Correlation does not imply causation. Most people are familiar with this phrase, and many recall typical examples of so-called “spurious correlations,” such as the correlation between stork populations and birth rates, clearly indicating: Storks bring babies. Or do they?
Causality, therefore, requires something more: To understand causality, we must also uncover, analyze, and understand the relationships between cause and effect. For this reason, the Cause and Effect Canvas was added to the Datentreiber Canvas Portfolio; to map complex problem areas.
This post already provides a preview of the new edition of the Datentreiber Canvas, through the use of the new design and the new slogan: “Train. Think. Transform.” These canvases are still under improvement and editing.
The starting point: identified problem areas
Let’s remember: at the beginning of this article series, we explored problem identification with the 3-Boxes Canvas – a tool that enables teams to retrospectively evaluate their performance and gain valuable insights for future decisions.
Today, we take another step in the strategic process and our fictional workshop: It’s about identifying problems not just symptomatically, but rather, the Canvas invites all participants (such as project managers, decision-makers, business strategists, employees) to systematically dive into the complex causal relationships within their company. Imagine a workshop leader and 10 participants coming together in a room, with the Canvas displayed either on a Din-A0 sheet or as a digital version on a Miro Board.
The Sad HIPPO Company
Let’s think back to the workshop participants of the “Sad HIPPO Company.” To recall: “HIPPO” stands for “Highest Paid Person’s Opinion” and serves as an analogy for non-data-driven decision-making in the company: After the 3-Boxes Canvas helped highlight the current problem areas – from delays in reporting to data issues to difficulties in ensuring data quality –, the team is now tasked with delving deeper into the underlying causes of these challenges.
Gathered in front of the yet unwritten Canvas, the Sad HIPPO Company team starts with the first step: The challenges identified through “Dot-Voting” in the 3-Boxes Canvas lay the foundation and are initially arranged on the right edge of the Canvas. This figuratively marks the starting point for an exploration path that is yet to be developed.
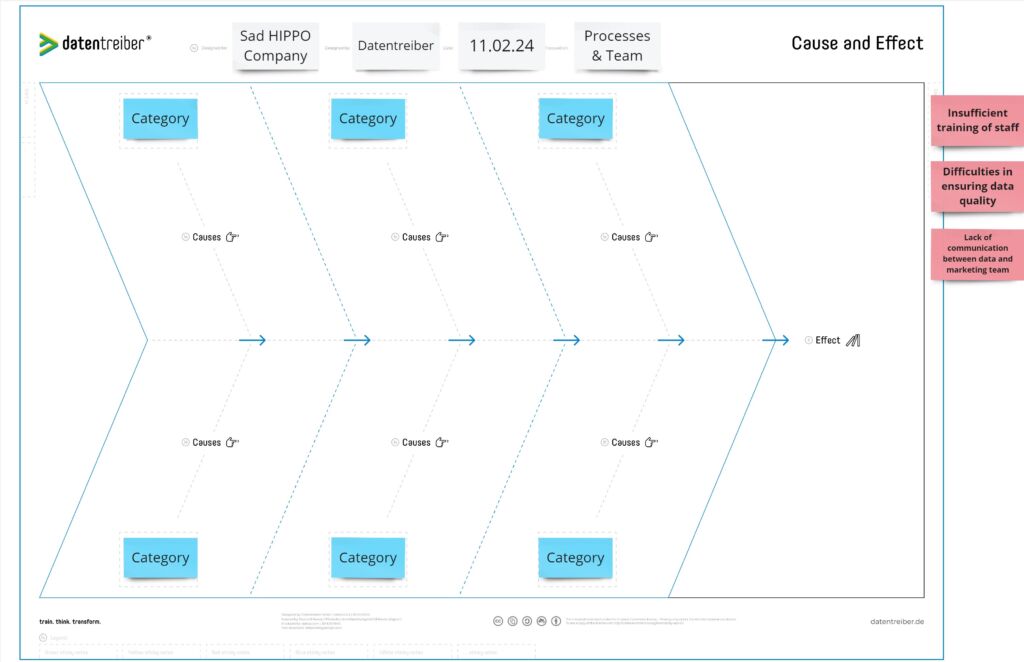


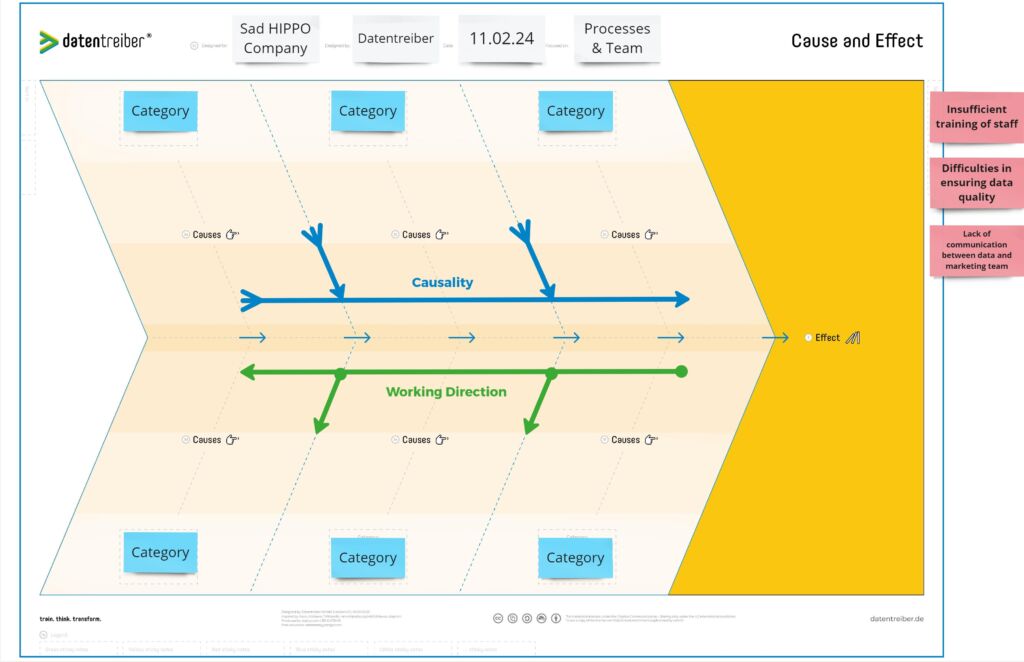
In the Cause and Effect Canvas, it is important: while the causal direction runs from left to right, it is intuitive and therefore advisable to work “backwards” along the causal chain, starting with the effect and proceeding from the most immediate (direct) cause. As participants move “back along the chain,” the causes become more indirectly linked to the effect. Through a series of intermediate steps, elements initially thought unrelated can suddenly be connected:
The Art of Categorization
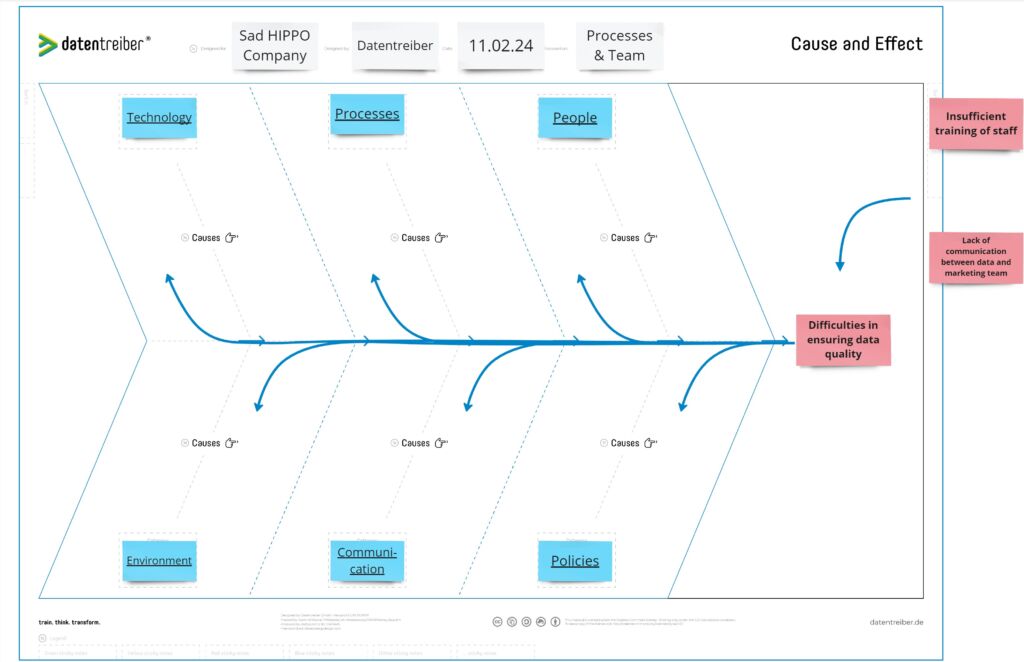
To further systematize the complexity of the listed problems, it is now necessary to create categories into which the causes can be sorted. Inspired by the classic categories of the fishbone diagram – such as Methods, Machines, People, Materials, Measurements, and Environment – the team begins to define their own categories. This step is carried out through a quick and focused process (10-15 min) that takes into account the structure of the Sad HIPPO Company, which may have emerged from the previous use of the “Business Model Canvas“.
With the help of the workshop leader and through discussion, they identify relevant areas directly linked to the main problem and adjust the classic categories accordingly: Processes, Technology, People, Environment, Communication, and Policies.
Targeted Inquiry as the Key
To investigate the main problem of “difficulties in ensuring data quality,” the team poses specific questions for each of the previously defined categories, utilizing the simple methodology of “targeted inquiry“. The Cause and Effect Canvas focuses on the “why” behind processes, whereas the Team Retrospective was still concerned with the “how“.
Each “why” leads to a new question, each step reveals a deeper layer of causes, by associating the main problem with the category to be explored. Questions arise such as:
- “Why do our current processes not lead to the desired data quality?”
- “Where in our processes do data errors occur, and why?”
- “Why are our technologies unable to prevent or correct data errors?”
- “Are there environmental conditions that favor systematic errors in data collection or processing?”
- “Why might existing policies be insufficient to ensure high data quality?”
Especially in this phase, the workshop leader is called upon and should support the team in estimating and maintaining the right level of granularity: Neither should the participants become too detailed in their search for causes nor too superficial. Here, it is about combining the right gut feeling with a clear timeframe.
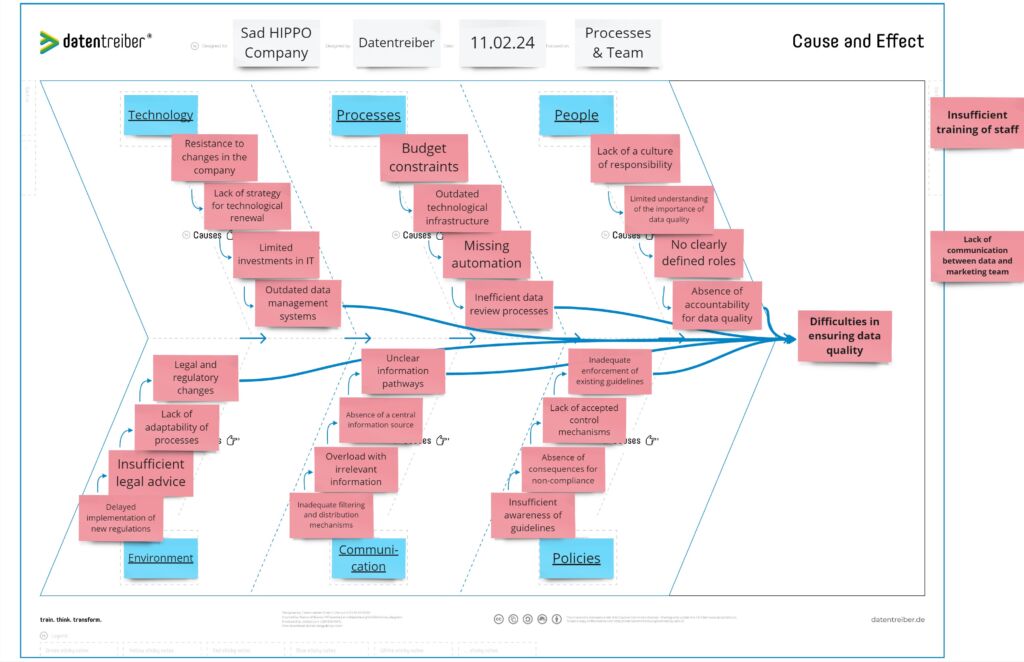
From Problem to Fault Tree
As the participants work “backwards” along the causal chain, starting with the most immediate (direct) causes and progressing to more distant, indirect causes, a structure of connections emerges that resembles a “tree.” Here, the main problem is the undesirable effect, and the found and diverging causal chains represent its causes. The Cause and Effect Canvas thus also resembles a so-called “fault tree”, which examines the negative drivers of a causal chain.
Naturally, a positive and desired effect can also be examined as a goal on the Canvas. The resulting tree can also be understood and used in analogy to the well-known “driver trees” (DuPont Analysis).
Discovering that elements initially thought to be unrelated can suddenly be brought into a logical connection deepens the understanding of the nature of the problems, resulting in a proper mapping of the problem area.
The iterative approach not only brings direct causes to light but also illuminates those further back in the chain. In the next article of this series, we will see how a re-application of the familiar 3-Boxes Canvas and a renewed focus on the “how” can create surprising and synergistic pathways to solutions by addressing the right “drivers” from the now-exposed causal chains.
The overview of cause-and-effect relationships that emerges in this first phase of visualization is rich in overlaps and potential categories. The team realizes that linear cause-and-effect relationships are rare in reality and that the true challenges lie in a web of causes. This insight leads to a deeper understanding of how the various factors are interconnected.
Clarify Your Data Strategy with Datentreiber
This systematic analysis and mapping of problem areas show how essential a deep understanding of the underlying connections is. But how can your company transform this process of discovery into practical strategies? DataDriver is ready to accompany you on this path of transformation.
We at Datentreiber also assist your company in becoming data-driven and thus future-proof. We support you in all processes, end-to-end:
From training your employees and executives to foster understanding and competencies in dealing with Data & AI. Through the development of a customized and fully integrated Data, AI, and Corporate Strategy using the proven Datentreiber Method. To the complete accompaniment in the sustainable transformation of your company and its employees, and the resulting innovation steps by our experienced experts trained in the Datentreiber Method.
Schedule your appointment today for a non-binding initial consultation with Georg Arens.